Feed — Datareisen
Datareisen (The Data Journey) is a free digital course that provides a basic introduction to data and what it means for you, your workplace and the society around us. The course has been developed in collaboration with Digital Norway and The University of Bergen, and is part of the university's course "Fantastic data". In addition to teaching students about data, the course is aimed at businesses in order to increase competence around the topic.
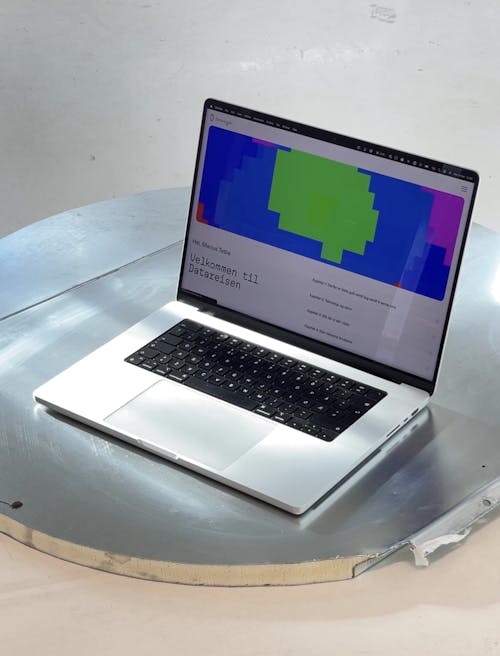
We designed and developed the course platform and its identity, where the supporting visual element is a data visualisation that evolves with the user's progress. This represents the user's own "data journey" and is generated based on username, progress and answered questions. The relationship between the visualisation and the culmination of data becomes clear to the user during the course. As a result, Datareisen's visual identity is unique to each user. Early on, we launched a 0.7 version with 3 out of 5 chapters. By using practical tools such as Miro and Hotjar, we’ve received feedback and ideas from the students while they’ve used Datareisen as part of the teaching.
How we made the blob
We started with a 3D shape in TouchDesigner, then tested different data inputs to create different movements. We added different textures and channel operators, worked on it to get the effects and movements that we wanted, and recreated it with Three.js to make it generative in realtime. The visualisation fetches data from our database and generates individual varieties in speed and colour.

Our role
Design
Visual Identity
UX
Front-end development
Back-end development
Illustrations in collaboration with NewsLab
Motion animation
Client
Universitet i Bergen
Digital Norway
Collaborators
Text by Newslab
Tech stack
Sanity
Next.js
TypeScript
Three.js
Prisma
Mailgun
Feide
Vercel
webGL
Credits
Edition Numerical by Elias Hanzer
Neue Haas Unica by Toshi Omagari
More Work


LundhagemNew website for one of Norway's most renowned architect firms.


